
U.S. Global Network Firms Inspection Data
These graphs reflect data included in the public portion of the inspection reports of six registered U.S. firms: Deloitte & Touche LLP (DT); Ernst & Young LLP (EY); KPMG LLP (KPMG); PricewaterhouseCoopers LLP (PwC); BDO USA, P.C. (BDO); and Grant Thornton LLP (GT).
The inspection data below is readily ascertainable from the public portion of the inspection report, but the data should be understood in light of contextualizing information provided with each report, including (1) it relates only to the audits selected for review, which does not constitute a representative sample of the firm’s total population of issuer audits, and only to the particular portions of the issuer audits reviewed; (2) for various reasons, inspection results are not necessarily comparable over time or among firms; (3) inspection results are not an assessment of all of the firm’s audit work nor of all of the audit procedures performed for the audits reviewed; and (4) inspection reports are not intended to serve as overall rating tools.
2023 Inspection Results
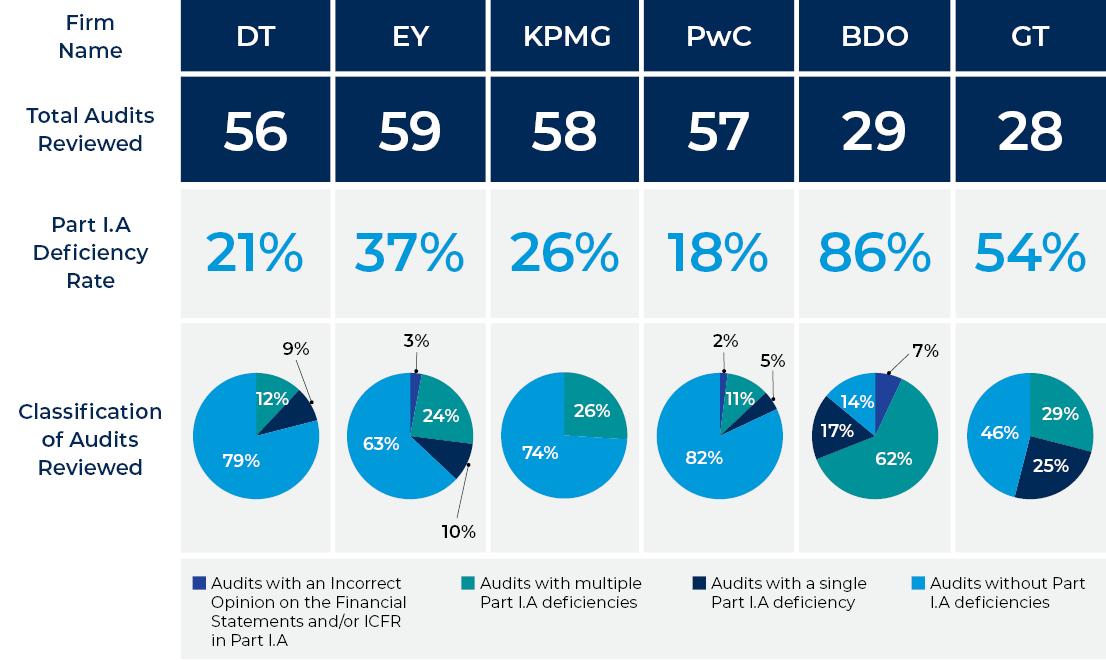
2023 Inspection Part I.A Deficiency Rate
An audit deficiency is cited and described in Part I.A of an inspection report if it is of such significance that we believe the firm, at the time it issued its audit report(s), had not obtained sufficient appropriate audit evidence to support its opinion(s) on the issuer’s financial statements and/or internal control over financial reporting (ICFR).
Part I.A Deficiency Rate by Group
Part I.A Deficiency Rate by Firm
Part I.A Deficiency Rate by Selection Method
Percentage of issuer audits reviewed, by selection method, that have at least one Part I.A deficiency in the inspection report for all firms.
Number of issuer audits, by type of opinions, affected by the identified Part I.A deficiency(ies).
Classification of Audits Reviewed
We select both integrated audits of financial statements and ICFR and audits of financial statement only.
Audits Selected for Review by Selection Method
We use a combination of risk-based and random methods to select issuer audits for review. Because our inspection process evolves over time, it can, and often does, focus on a different mix of issuer audits and audit areas from year to year and firm to firm. In addition, we utilize a target team of inspectors to perform inspection procedures in areas of current risk and emerging topics. More information on the focus of the target team procedures in each year can be found in the relevant inspection report.
Auditing Standards With Frequent Part I.A Deficiencies by
Audit Area
Inspection Results by Issuer Revenue
Part I.A Deficiencies by the Engagement Partner's Tenure With the Issuer
This graph depicts the number of issuer audits identified for each firm by Part I.B deficiency type. Part I.B deficiencies are certain deficiencies that relate to instances of non-compliance with PCAOB standards or rules other than those where the firm had not obtained sufficient appropriate audit evidence to support its opinions.